
Utility-scale solar projects increasingly pair photovoltaic arrays with battery energy storage systems (BESS) to meet grid requirements, capture higher revenues, and improve project bankability. Yet one of the most common sources of delay, cost overrun, and performance shortfall remains incorrect BESS sizing. Confusing power (MW) with energy (MWh), overlooking duration, or miscalculating the number of power conversion system (PCS) units can turn a promising solar-plus-storage plant into an underperforming asset.
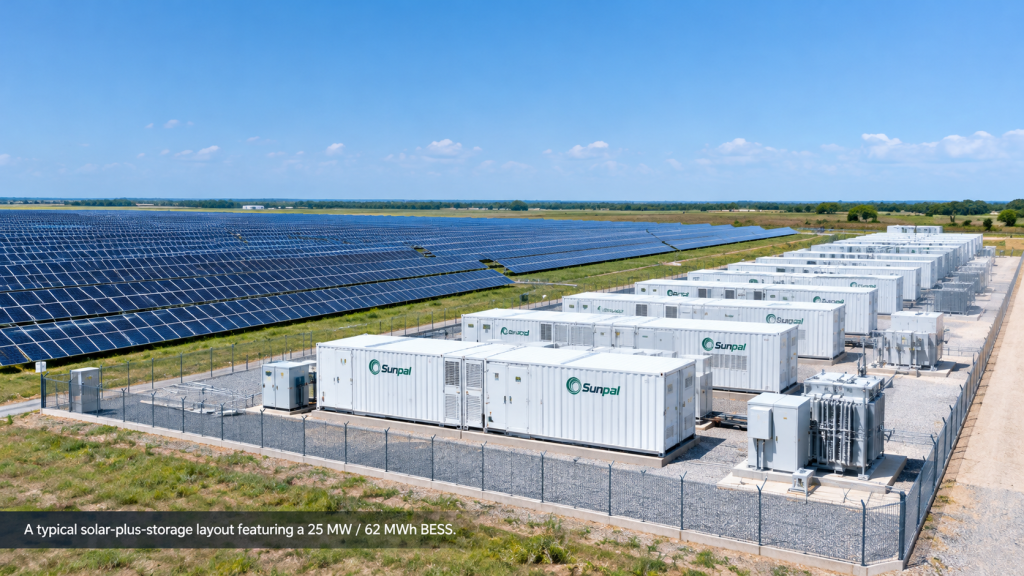
This guide walks through a practical, end-to-end approach to utility-scale battery storage sizing using a realistic reference case of a 25 MW / 62 MWh BESS. The example is large enough to reflect real commercial projects yet small enough for clear calculations. Along the way we examine MW versus MWh, storage duration, round-trip efficiency (RTE), depth of discharge (DoD), C-rate, PCS quantity, battery container count, transformer configuration, and grid connection considerations.
Why Accurate BESS Sizing Matters More Than Ever
Grid operators now routinely require solar plants to provide firm capacity, ramp-rate control, or energy shifting. Offtake contracts and capacity markets reward systems that can deliver power for a defined number of hours. At the same time, capital costs for lithium-ion batteries remain significant, so oversizing wastes money while undersizing leaves revenue on the table.
A well-executed solar BESS calculation balances these competing demands. The 25 MW / 62 MWh reference case illustrates how engineers, EPCs, and project owners can move from high-level requirements to a detailed equipment list without guesswork.
Utility-Scale BESS Duration Trends, 2021–2025
Estimated share of new utility-scale battery energy storage capacity by duration category, with an illustrative average duration trend.
4-Hour Systems Gain Share
The estimated share of 4-hour systems increases from 40% in 2021 to 60% in 2025, reflecting growing demand for longer energy-shifting periods.
2–4-Hour Systems Dominate
The combined share of 2-hour and approximately 4-hour systems reaches 80% in 2025 in this illustrative dataset.
Shorter-Duration Share Declines
The estimated share of 1-hour systems falls from 25% in 2021 to 8% in 2025 as applications increasingly prioritize energy shifting and peak coverage.
Source: Directional estimates synthesized from publicly available IEA, LBNL, NREL/EIA, Wood Mackenzie and industry reports. Percentages represent illustrative capacity shares, not verified annual market statistics. The average-duration line is illustrative and combines figures reported for different markets and measurement scopes. Actual distributions vary by region and project type.
MW, MWh, and Duration: The Foundation of Every Solar BESS Calculation
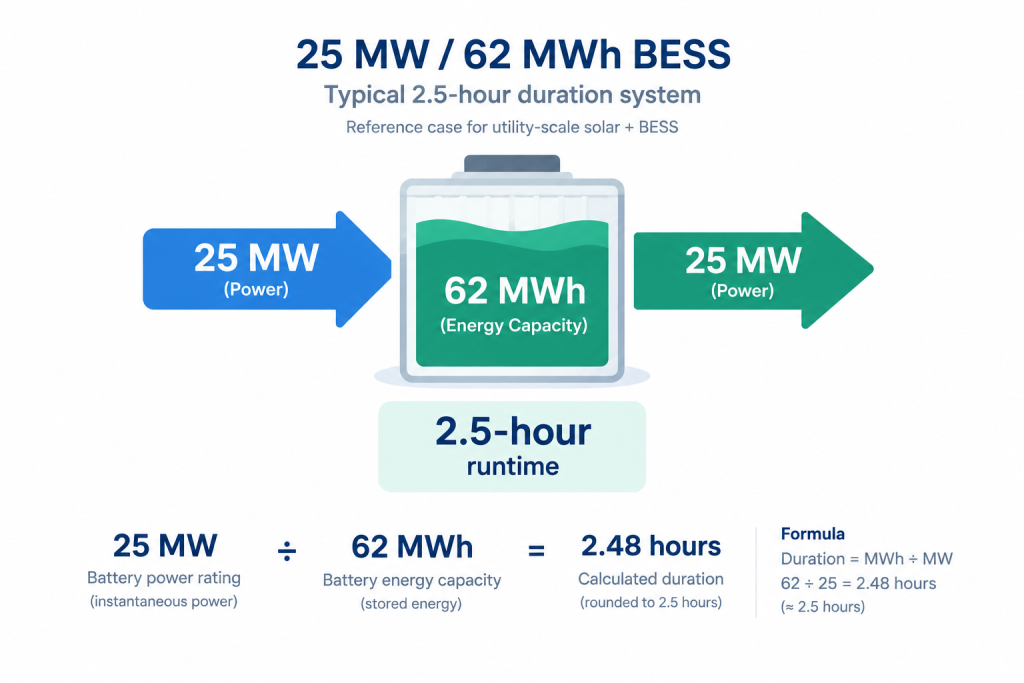
Power rating (MW) defines how much electricity the BESS can inject or absorb at any instant. Energy capacity (MWh) defines how long it can sustain that power. Duration is simply the ratio:
Duration (hours) = MWh ÷ MW
For the reference case:
62 MWh ÷ 25 MW = 2.48 hours, commonly referred to as a 2.5-hour system.
This distinction is fundamental to utility-scale battery storage sizing. A 25 MW / 25 MWh system can deliver full power for only one hour, while a 25 MW / 100 MWh system can sustain full power for four hours. The choice depends on the primary use case—energy shifting for evening peaks, capacity firming, frequency regulation, or a combination.
In most current utility-scale solar markets, 2-hour and 4-hour systems dominate. The 2.5-hour reference case sits comfortably in the middle and is frequently specified when projects need to cover late-afternoon to early-evening demand windows without the full cost of a four-hour battery.
Key Technical Parameters That Shape Real-World Performance
Nameplate numbers rarely equal usable performance. Four parameters consistently influence the final solar BESS calculation.
Round-Trip Efficiency (RTE)
RTE measures the percentage of energy recovered after a full charge-discharge cycle. Modern lithium-ion systems typically achieve 88–94 % DC RTE and slightly lower AC RTE once PCS and transformer losses are included. For the reference case, assume 90 % AC RTE. To deliver 62 MWh to the grid, the battery must store approximately 69 MWh on the DC side. This adjustment directly affects container count and capital cost.
Depth of Discharge (DoD)
Most utility-scale lithium-ion batteries are warranted for 80–90 % DoD on a daily basis. Operating at shallower DoD extends cycle life but reduces usable energy. Project owners often apply a 5–10 % capacity buffer so that the system can still meet the 62 MWh contractual requirement after several years of degradation.
C-rate
C-rate describes how fast the battery charges or discharges relative to its capacity. A 2.5-hour system operates at roughly 0.4C. Lower C-rates generally improve efficiency and thermal performance and allow the use of energy-optimized cells rather than high-power cells.
Degradation and Augmentation
Batteries lose capacity over time. A typical warranty guarantees 70 % residual capacity after 15–20 years or a defined number of cycles. Developers frequently oversize the initial installation or plan modular augmentation to maintain the contracted 62 MWh throughout the project life.
When these factors are applied to the 25 MW / 62 MWh reference case, the nameplate energy capacity often lands 10–15 % higher than the contracted usable energy.
BESS Usable Energy Degradation Over 20 Years
Comparison of usable energy retention for a 25 MW / 62 MWh battery energy storage system under three Depth of Discharge (DoD) and augmentation strategies.
90% DoD Without Augmentation
Usable energy decreases from 55.8 MWh at Year 0 to 38.8 MWh at Year 20 under the supplied estimates.
80% DoD Without Augmentation
The initial usable energy is 49.6 MWh, declining to 34.5 MWh by Year 20.
90% DoD With Augmentation
A one-time capacity addition at the end of Year 10 restores usable energy to 55.8 MWh, followed by continued degradation.
Model assumptions: 62 MWh beginning-of-life
nameplate capacity; approximately 1.8% annual degradation;
usable energy calculated using the specified DoD and remaining
capacity factor. Scenario C assumes one-time augmentation at
the end of Year 10.
Important: These are illustrative engineering
estimates, not a guaranteed battery performance forecast.
Actual degradation and usable energy depend on cell chemistry,
operating temperature, cycling profile, system losses,
augmentation sizing and warranty conditions.
Sizing the Power Conversion System: Matching Power to Reality
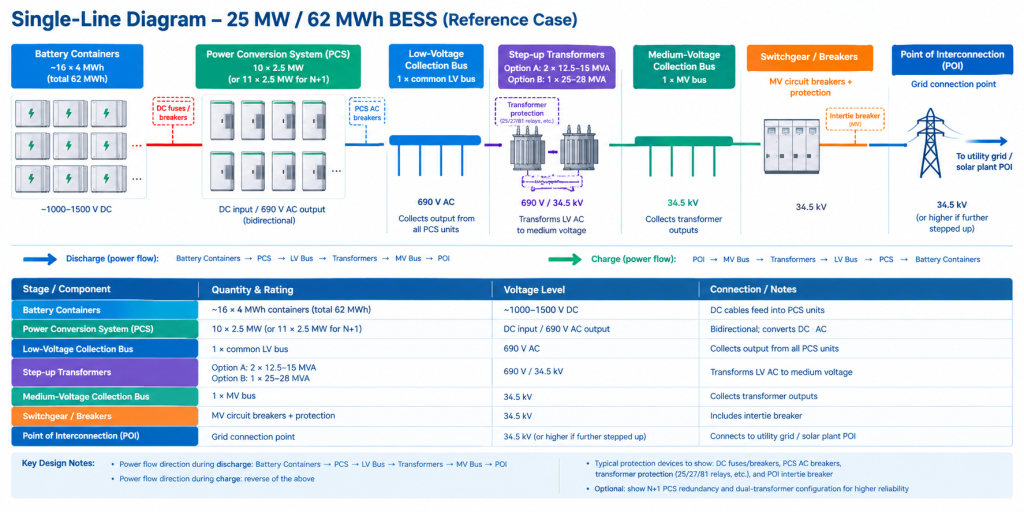
The PCS converts DC battery power to AC grid power and vice versa. Its continuous rating must at least equal the BESS power rating—in this case 25 MW. In practice, engineers select standard PCS blocks (commonly 1.72 MW, 2.5 MW, 3.45 MW, or 5 MW units) and decide on redundancy.
For a 25 MW system using 2.5 MW PCS units, ten units provide exact matching. Many EPCs add an N+1 configuration (eleven units) so that the plant can still deliver full power during maintenance or a single failure. Some projects accept N+0 and rely on temporary de-rating.
PCS selection also affects reactive power capability, harmonic performance, and the ability to operate in grid-forming mode—features increasingly required by system operators. When the BESS is co-located with a solar plant, the PCS must coordinate with the solar inverters through a plant controller to respect the overall interconnection limit.
Calculating Battery Containers and Site Footprint
Modern utility-scale BESS use factory-assembled containers, typically 20-ft or 40-ft enclosures that integrate battery racks, thermal management, fire suppression, and controls. Energy density continues to rise; many current containers deliver 3–5 MWh or more.
For a 62 MWh nameplate system, a conservative estimate using 4 MWh containers yields approximately 16 containers. After adding space for HVAC, fire barriers, and maintenance access, the battery yard for a 25 MW / 62 MWh system often occupies 0.5–1 hectare, depending on local fire codes and layout efficiency.
Container count scales almost linearly with energy capacity. Moving from 2.5-hour to 4-hour duration at the same 25 MW power rating would increase the container count by roughly 60 %, with corresponding impacts on civil works and cable lengths.
Battery Container Requirements for a 25 MW BESS
Estimated number of battery containers at three storage durations, assuming a fixed 25 MW power rating and approximately 4 MWh of energy capacity per container.
1-Hour Duration
7 Containers
25 MWh energy capacity
2.5-Hour Duration
16 Containers
62 MWh energy capacity · Reference case
4-Hour Duration
25 Containers
100 MWh energy capacity
Calculation basis: Container count =
energy capacity ÷ approximately 4 MWh per container,
rounded up to the next whole container.
Important: Estimates are for preliminary
comparison. Actual container quantities depend on usable
energy per container, system configuration, auxiliary loads,
HVAC, fire protection, required redundancy and installation
layout. The 25 MW power rating remains constant across all
three scenarios.
Transformer Configuration and Medium-Voltage Collection
The PCS output is usually at low voltage (480–690 V). Step-up transformers raise this voltage to the plant collection level, commonly 34.5 kV. For the 25 MW reference case, two 12.5 MVA or one 28 MVA transformer are typical options. Dual-transformer configurations improve reliability and allow partial operation during maintenance.
Some projects share transformers with the solar array; others use dedicated BESS transformers to simplify metering and control. Transformer losses (usually 0.5–1 %) further reduce overall system RTE and should be included in the solar BESS calculation.
Cable sizing, switchgear ratings, and protection settings must accommodate both continuous 25 MW flow and short-circuit contributions from the batteries and PCS.
Grid Connection: Ensuring the System Can Actually Export
Even a perfectly sized BESS is useless if it cannot connect. Most utility-scale solar plants already hold an interconnection agreement that specifies maximum export capacity. Adding a 25 MW BESS may require a material modification study if the combined solar-plus-storage output can exceed the original limit.
Key studies include steady-state load flow, short-circuit, dynamic stability, and harmonic analysis. Grid codes increasingly demand fast frequency response, voltage control, and, in some markets, black-start capability. The plant controller must manage simultaneous or sequential dispatch of solar and storage so that the point of interconnection never exceeds its licensed capacity.
In the reference case, a common approach is to allow the BESS to charge from the solar array during the day (reducing grid export) and discharge in the evening when solar production has fallen, thereby extending the plant’s effective generation window without increasing peak export.
Putting It All Together: A Practical Sizing Workflow
- Define the primary use cases and required duration.
- Set the power rating (25 MW) and usable energy target (62 MWh).
- Apply RTE, DoD, and degradation factors to determine nameplate MWh.
- Select PCS block size and decide on redundancy; calculate the number of units.
- Determine battery container count from current energy density figures.
- Size step-up transformers and medium-voltage collection equipment.
- Validate the entire system against the grid interconnection agreement and local codes.
- Iterate for cost, footprint, and performance.
Suggested summary table:
| Parameter | Reference Case Value | Notes |
| Power | 25 MW | Continuous PCS rating |
| Energy | 62 MWh | Usable at beginning of life |
| Duration | 2.5 hours | 62 ÷ 25 |
| PCS units (N+0) | 10 × 2.5 MW | Exact match |
| Battery containers | ~16 × 4 MWh | Approximate |
| Transformers | 2 × 12.5 MVA or 1 × 28 MVA | Typical options |
This workflow keeps every major decision visible and traceable—an essential requirement for EPC contracts and lender technical due diligence.
Common Pitfalls and How to Avoid Them
- Treating MW and MWh as interchangeable.
- Ignoring auxiliary loads and transformer losses when calculating RTE.
- Selecting PCS quantity without considering future augmentation.
- Underestimating fire-safety clearances that inflate site footprint.
- Overlooking interconnection upgrade costs until late in development.
Addressing these issues early with a structured solar BESS calculation saves both time and capital.
Conclusion: From Reference Case to Your Project
The 25 MW / 62 MWh example demonstrates that utility-scale battery storage sizing is neither pure science nor pure art. It is a structured process that begins with clear definitions of power, energy, and duration, then layers on efficiency, lifetime, equipment standardization, and grid constraints.
EPCs, developers, and project owners who master this process gain a measurable advantage: faster interconnection approval, more accurate financial models, and storage systems that actually deliver the services they were designed to provide. Use the reference case as a template, adjust the numbers to your site’s solar profile, offtake contract, and grid requirements, and you will be well on the way to a correctly sized, bankable solar-plus-storage plant.
Ready to size your next BESS project with confidence?
Contact Us today — our engineering team is ready to help you apply this framework to your specific site and requirements.